The field service metrics that actually predict business health
Most dashboards report activity. The ones that matter surface the numbers that move profitability, efficiency, and long-term growth.
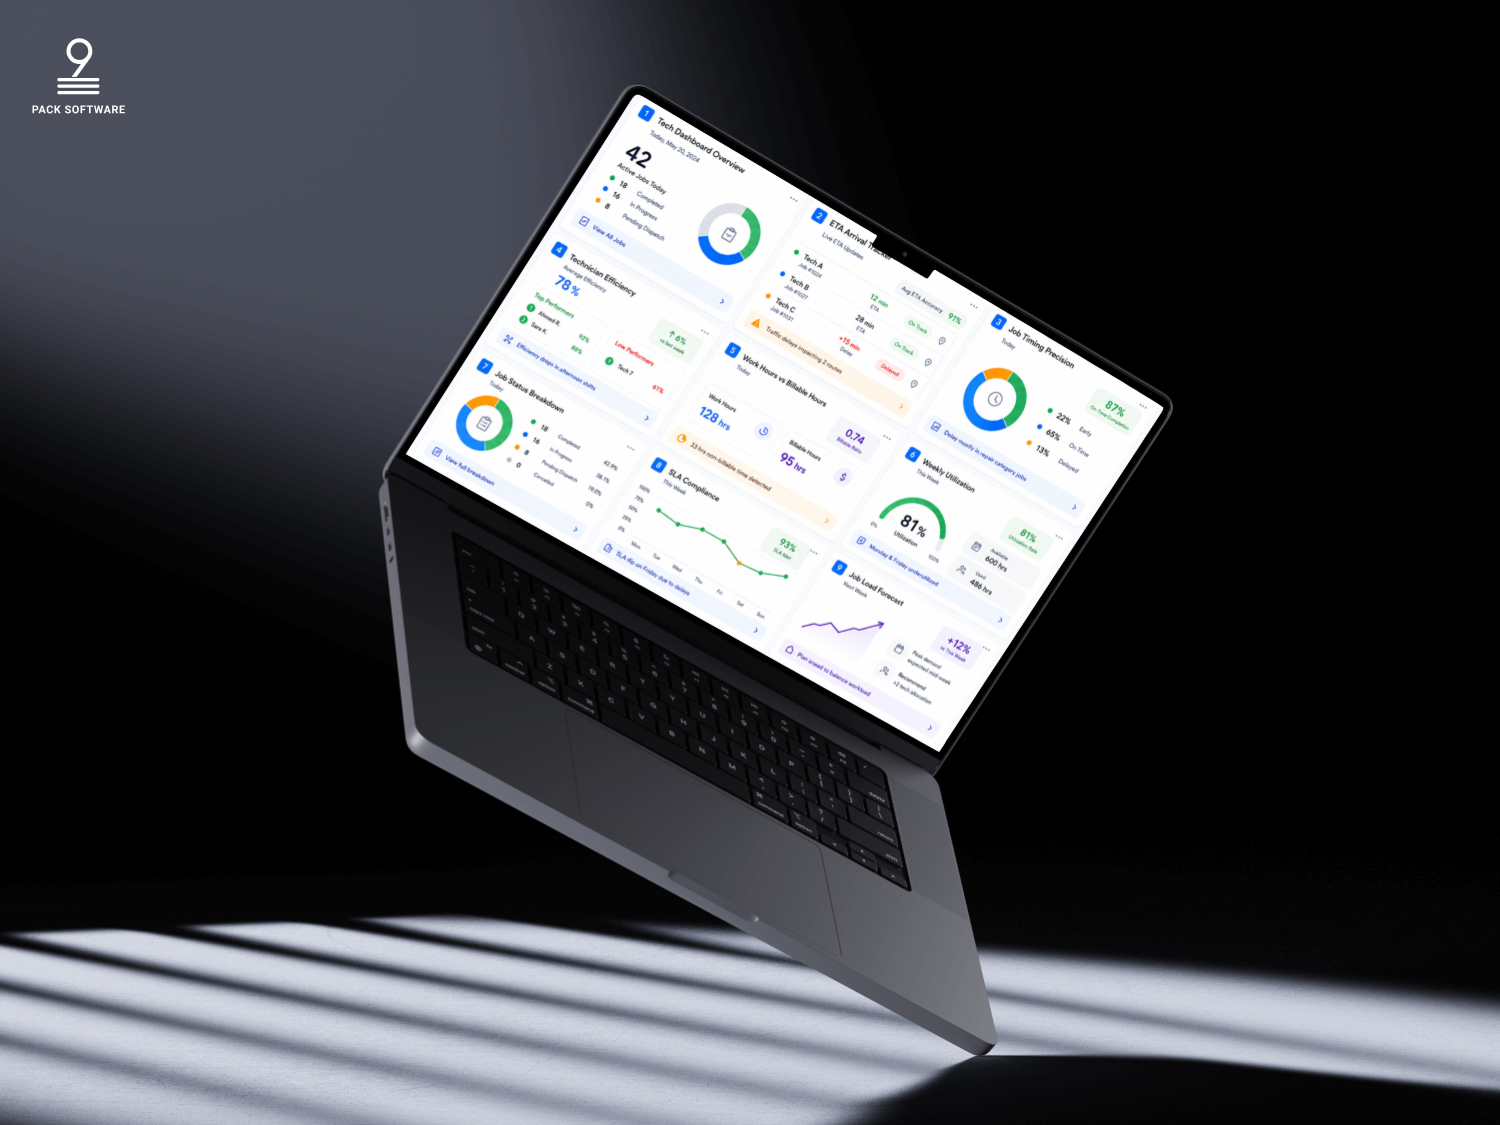
Many service organizations track activity metrics — calls completed, hours logged, tickets closed. Useful, but they don’t directly measure financial performance or business health.
Operational dashboards should do more than report activity. They should help leaders make informed, data-driven decisions that improve profitability, efficiency, and long-term growth. The most valuable field service dashboards focus on the metrics that directly impact business performance.
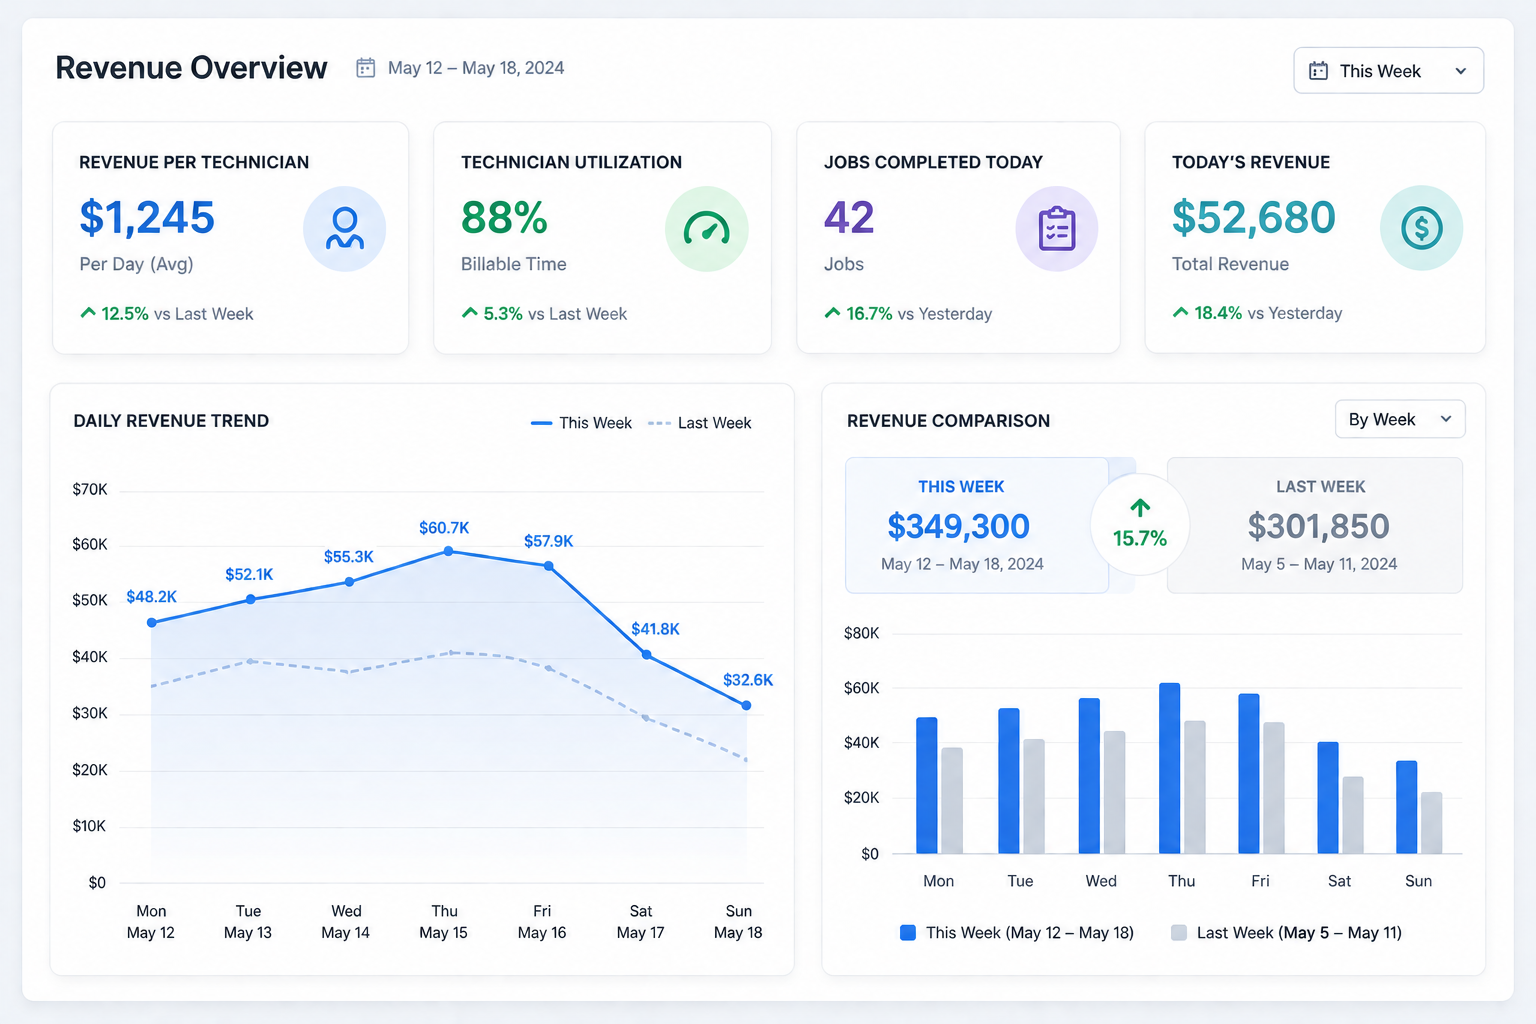
Revenue Per Technician Per Day
This metric measures both technician productivity and utilization. It helps determine whether dispatch efficiency, scheduling, and pricing strategies are aligned to maximize daily revenue.
A consistently increasing revenue-per-technician figure often indicates stronger workforce utilization and healthier business performance.
Gross Margin Per Ticket
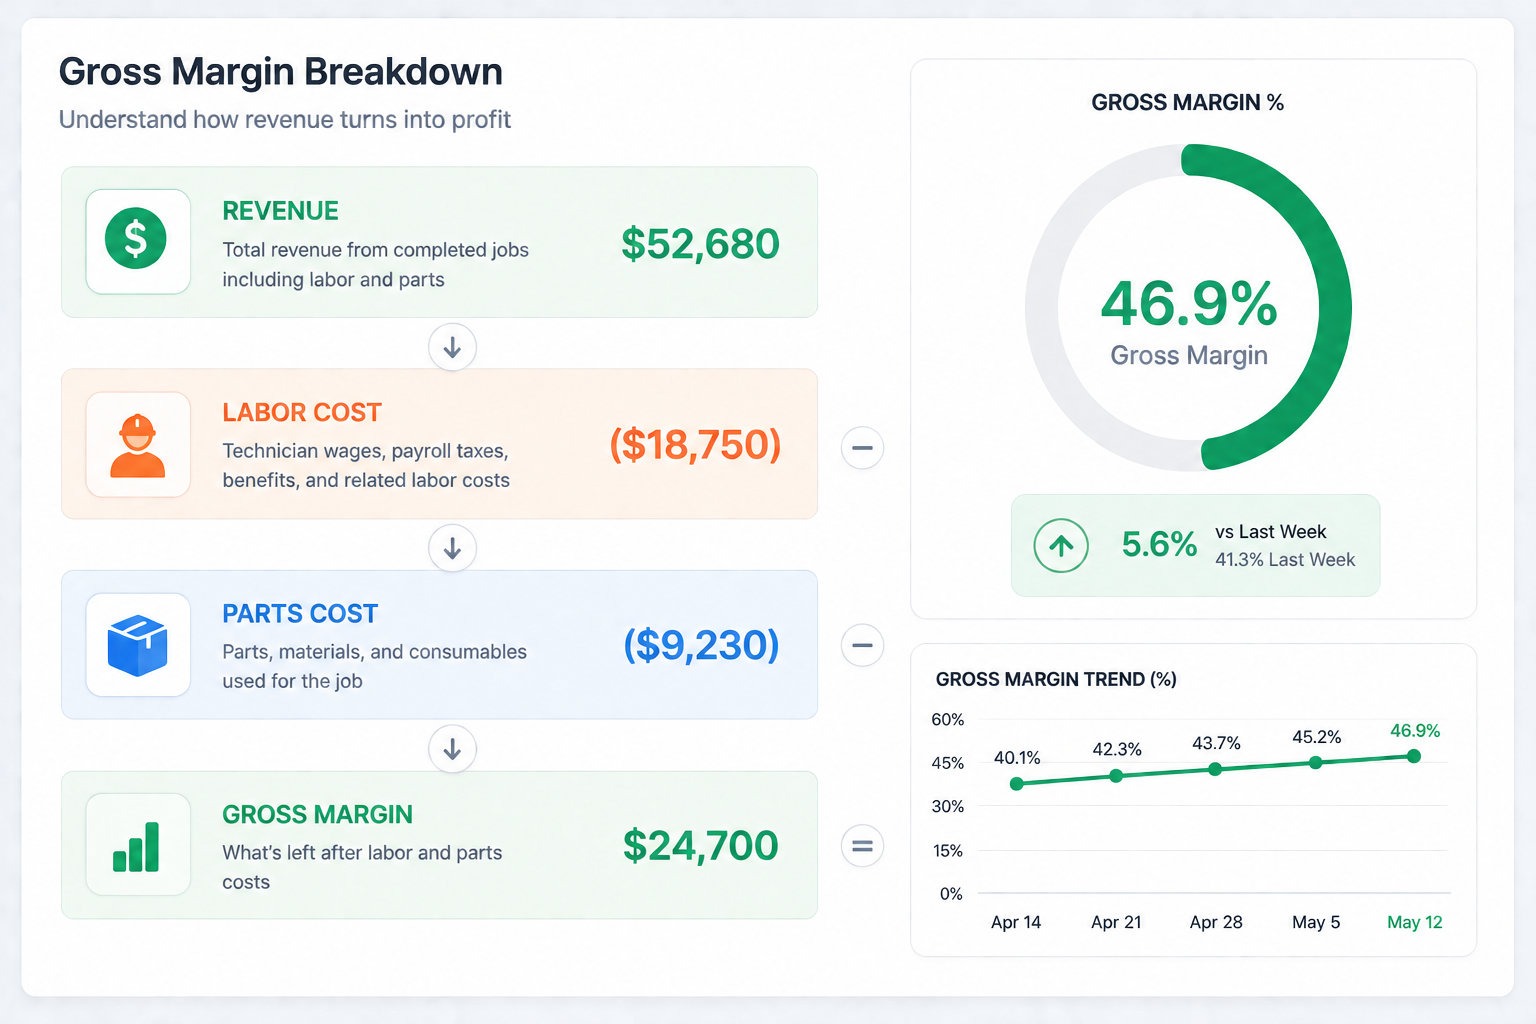
Revenue alone doesn’t tell the full story. Gross margin reveals how profitable each completed job actually is after accounting for labor and parts costs.
Tracking this metric helps identify:
•
Pricing opportunities
•
Labor efficiency
•
Parts management effectiveness
•
High- and low-performing service types
Organizations that monitor margin consistently make better pricing and operational decisions.
First-Time Fix Rate (FTFR)
A high First-Time Fix Rate reduces callbacks, minimizes travel costs, improves technician productivity, and increases customer satisfaction.
Every repeat visit consumes valuable time that could be spent completing new work orders. Improving FTFR increases service capacity without increasing headcount.
Invoice Cycle Time
Cash flow is one of the strongest indicators of operational health. The faster invoices are generated after job completion, the sooner payments are received — improving liquidity and allowing businesses to reinvest in growth.
Monitoring invoice cycle time helps identify billing bottlenecks before they impact cash flow.
Parts-to-Labor Ratio
An unusual parts-to-labor ratio can reveal deeper operational issues, including:
•
Incorrect diagnoses
•
Inefficient inventory management
•
Poor pricing strategies
•
Excessive parts replacement
•
Technician training opportunities
This metric helps managers identify trends that aren’t immediately obvious from revenue reports alone.
Turn Data Into Decisions
Dashboards should be decision engines — not decorative reports. If leadership cannot identify revenue trends, margin performance, technician productivity, and operational bottlenecks within minutes of opening a dashboard, the reporting architecture needs improvement.
The best dashboards don’t overwhelm users with data — they surface the metrics that matter most and enable faster, more confident decision-making.
Clarity creates control. Control creates scalability.

Adam Davis
CEO & Founder of 9 Pack Software
Ready to Streamline your Business?
Book a Demo with our experts to see how our software can transform your operations.
Book Demo


The field service metrics that actually predict business health
Most dashboards report activity. The ones that matter surface the numbers that move profitability, efficiency, and long-term growth.
Many service organizations track activity metrics — calls completed, hours logged, tickets closed. Useful, but they don’t directly measure financial performance or business health.
Operational dashboards should do more than report activity. They should help leaders make informed, data-driven decisions that improve profitability, efficiency, and long-term growth. The most valuable field service dashboards focus on the metrics that directly impact business performance.
Revenue Per Technician Per Day
This metric measures both technician productivity and utilization. It helps determine whether dispatch efficiency, scheduling, and pricing strategies are aligned to maximize daily revenue.
A consistently increasing revenue-per-technician figure often indicates stronger workforce utilization and healthier business performance.
Gross Margin Per Ticket
Revenue alone doesn’t tell the full story. Gross margin reveals how profitable each completed job actually is after accounting for labor and parts costs.
Tracking this metric helps identify:
•
Pricing opportunities
•
Labor efficiency
•
Parts management effectiveness
•
High- and low-performing service types
Organizations that monitor margin consistently make better pricing and operational decisions.
First-Time Fix Rate (FTFR)
A high First-Time Fix Rate reduces callbacks, minimizes travel costs, improves technician productivity, and increases customer satisfaction.
Every repeat visit consumes valuable time that could be spent completing new work orders. Improving FTFR increases service capacity without increasing headcount.
Invoice Cycle Time
Cash flow is one of the strongest indicators of operational health. The faster invoices are generated after job completion, the sooner payments are received — improving liquidity and allowing businesses to reinvest in growth.
Monitoring invoice cycle time helps identify billing bottlenecks before they impact cash flow.
Parts-to-Labor Ratio
An unusual parts-to-labor ratio can reveal deeper operational issues, including:
•
Incorrect diagnoses
•
Inefficient inventory management
•
Poor pricing strategies
•
Excessive parts replacement
•
Technician training opportunities
This metric helps managers identify trends that aren’t immediately obvious from revenue reports alone.
Turn Data Into Decisions
Dashboards should be decision engines — not decorative reports. If leadership cannot identify revenue trends, margin performance, technician productivity, and operational bottlenecks within minutes of opening a dashboard, the reporting architecture needs improvement.
The best dashboards don’t overwhelm users with data — they surface the metrics that matter most and enable faster, more confident decision-making.
Clarity creates control. Control creates scalability.
Adam Davis
CEO & Founder of 9 Pack Software
Ready to Streamline your Business?
Book a Demo with our experts to see how our software can transform your operations.
Book Demo


The field service metrics that actually predict business health
Most dashboards report activity. The ones that matter surface the numbers that move profitability, efficiency, and long-term growth.
Many service organizations track activity metrics — calls completed, hours logged, tickets closed. Useful, but they don’t directly measure financial performance or business health.
Operational dashboards should do more than report activity. They should help leaders make informed, data-driven decisions that improve profitability, efficiency, and long-term growth. The most valuable field service dashboards focus on the metrics that directly impact business performance.
Revenue Per Technician Per Day
This metric measures both technician productivity and utilization. It helps determine whether dispatch efficiency, scheduling, and pricing strategies are aligned to maximize daily revenue.
A consistently increasing revenue-per-technician figure often indicates stronger workforce utilization and healthier business performance.
Gross Margin Per Ticket
Revenue alone doesn’t tell the full story. Gross margin reveals how profitable each completed job actually is after accounting for labor and parts costs.
Tracking this metric helps identify:
•
Pricing opportunities
•
Labor efficiency
•
Parts management effectiveness
•
High- and low-performing service types
Organizations that monitor margin consistently make better pricing and operational decisions.
First-Time Fix Rate (FTFR)
A high First-Time Fix Rate reduces callbacks, minimizes travel costs, improves technician productivity, and increases customer satisfaction.
Every repeat visit consumes valuable time that could be spent completing new work orders. Improving FTFR increases service capacity without increasing headcount.
Invoice Cycle Time
Cash flow is one of the strongest indicators of operational health. The faster invoices are generated after job completion, the sooner payments are received — improving liquidity and allowing businesses to reinvest in growth.
Monitoring invoice cycle time helps identify billing bottlenecks before they impact cash flow.
Parts-to-Labor Ratio
An unusual parts-to-labor ratio can reveal deeper operational issues, including:
•
Incorrect diagnoses
•
Inefficient inventory management
•
Poor pricing strategies
•
Excessive parts replacement
•
Technician training opportunities
This metric helps managers identify trends that aren’t immediately obvious from revenue reports alone.
Turn Data Into Decisions
Dashboards should be decision engines — not decorative reports. If leadership cannot identify revenue trends, margin performance, technician productivity, and operational bottlenecks within minutes of opening a dashboard, the reporting architecture needs improvement.
The best dashboards don’t overwhelm users with data — they surface the metrics that matter most and enable faster, more confident decision-making.
Clarity creates control. Control creates scalability.
Adam Davis
CEO & Founder of 9 Pack Software
Ready to Streamline your Business?
Book a Demo with our experts to see how our software can transform your operations.
Book Demo
The field service metrics that actually predict business health
Most dashboards report activity. The ones that matter surface the numbers that move profitability, efficiency, and long-term growth.
Many service organizations track activity metrics — calls completed, hours logged, tickets closed. Useful, but they don’t directly measure financial performance or business health.
Operational dashboards should do more than report activity. They should help leaders make informed, data-driven decisions that improve profitability, efficiency, and long-term growth. The most valuable field service dashboards focus on the metrics that directly impact business performance.
Revenue Per Technician Per Day
This metric measures both technician productivity and utilization. It helps determine whether dispatch efficiency, scheduling, and pricing strategies are aligned to maximize daily revenue.
A consistently increasing revenue-per-technician figure often indicates stronger workforce utilization and healthier business performance.
Gross Margin Per Ticket
Revenue alone doesn’t tell the full story. Gross margin reveals how profitable each completed job actually is after accounting for labor and parts costs.
Tracking this metric helps identify:
•
Pricing opportunities
•
Labor efficiency
•
Parts management effectiveness
•
High- and low-performing service types
Organizations that monitor margin consistently make better pricing and operational decisions.
First-Time Fix Rate (FTFR)
A high First-Time Fix Rate reduces callbacks, minimizes travel costs, improves technician productivity, and increases customer satisfaction.
Every repeat visit consumes valuable time that could be spent completing new work orders. Improving FTFR increases service capacity without increasing headcount.
Invoice Cycle Time
Cash flow is one of the strongest indicators of operational health. The faster invoices are generated after job completion, the sooner payments are received — improving liquidity and allowing businesses to reinvest in growth.
Monitoring invoice cycle time helps identify billing bottlenecks before they impact cash flow.
Parts-to-Labor Ratio
An unusual parts-to-labor ratio can reveal deeper operational issues, including:
•
Incorrect diagnoses
•
Inefficient inventory management
•
Poor pricing strategies
•
Excessive parts replacement
•
Technician training opportunities
This metric helps managers identify trends that aren’t immediately obvious from revenue reports alone.
Turn Data Into Decisions
Dashboards should be decision engines — not decorative reports. If leadership cannot identify revenue trends, margin performance, technician productivity, and operational bottlenecks within minutes of opening a dashboard, the reporting architecture needs improvement.
The best dashboards don’t overwhelm users with data — they surface the metrics that matter most and enable faster, more confident decision-making.
Clarity creates control. Control creates scalability.
Adam Davis
CEO & Founder of 9 Pack Software
Ready to Streamline your Business?
Book a Demo with our experts to see how our software can transform your operations.
Book Demo